Response 44 - Graphs, Maps, Trees
Dear Marie,
When we were delayed in Stansted Airport in a heatwave waiting for a flight to Ireland a couple of weeks ago, I started reading an essay by Johanna Drucker, an author who I think of as part of ‘critical’ digital humanities, called ‘Humanities Approaches to Graphical Display’ (Digital Humanities Quarterly 2011, 5:1; numbers in brackets below refers to paragraph numbers in the online text).
The article is described by Drucker as a polemic directed against the unsophisticated or disingenuous adoption of ‘objective’ techniques of graphical display in the digital humanities, pointing to, for example, the work of Franco Moretti as embodying ‘assumptions of knowledge as observer dependent and certain, rather than observer co-dependent and interpretative’ (this phrase is from the article abstract). She means by this that work like Moretti’s disguises the interpretative decisions that constitute its ‘data’, presenting that data as self-evident and unambiguous. Drucker argues that the idea of ‘data’ itself (the root of the word suggests ‘given’) is wrong, and needs to be replaced with a concept of ‘capta’, meaning something actively ‘taken’ and constructed. Drucker is making a strong argument for a humanistic rather than a ‘realist’ approach to knowledge and information visualization. Whereas the realist approach assumes that phenomena are observer-independent, writes Drucker:
- Humanistic inquiry acknowledges the situated, partial, and constitutive character of knowledge production, the recognition that knowledge is constructed, taken, not simply given as a natural representation of pre-existing fact. (3)
- […] the apprehension of the phenomena of the physical, social, cultural world is through constructed and constitutive acts, not mechanistic or naturalistic realist representation of pre-existing or self-evident information. (7)
- […] the humanistic concept of knowledge depends upon the interplay between a stated and circumstantial viewer and the objects or experiences under examination and interpretation. (51)
Ambiguity and interpretation are central to Drucker’s idea of knowledge but she is not just suggesting that ambiguity should be represented (say as degrees of uncertainty on a chart): rather, she insists that we use the ‘interpretations that arise in observer-codependence, characterised by ambiguity and uncertainty, as the basis on which a representation is constructed’ (2). So, parameters themselves in a diagram need to express ambiguity and to reveal their interpretative character, and not only the values they help to plot.
The article goes on to imagine how graphical and diagrammatic display can provide ‘a systematic expression of information understood as constructed, as phenomena perceived according to principles of interpretation’ (14). What this means is that all metrics (instruments or units of measurement) are seen ‘“as a factor of X”, where X is a point of view, agenda, assumption, presumption, or simply a convention’ (14). As a result, scale divisions are no longer treated as equal. Days of the week, as in an example given below, might not be represented as regular units on one axis of a graph, but might morph in scale and shape according to the emotional investment in the content of (parts of) a particular day. In that case, ‘time’ is not treated as a given, but treated instead ‘as a factor of emotion’. (For Drucker, ‘time as a factor of X’ is described as ‘temporality’ (31) — it’s a very good definition, I think.)
I find this stuff very inspiring and I hope my summary doesn’t seem too obscure. Drucker admits the difficulty of what she has in mind, partly because of the ingrained habits we need to break, and partly because of the complexity of building in ambiguity and interpretation to the very metrics of graphical display. I’m not sure her own diagrammatic examples clear matters up, but here’s one.
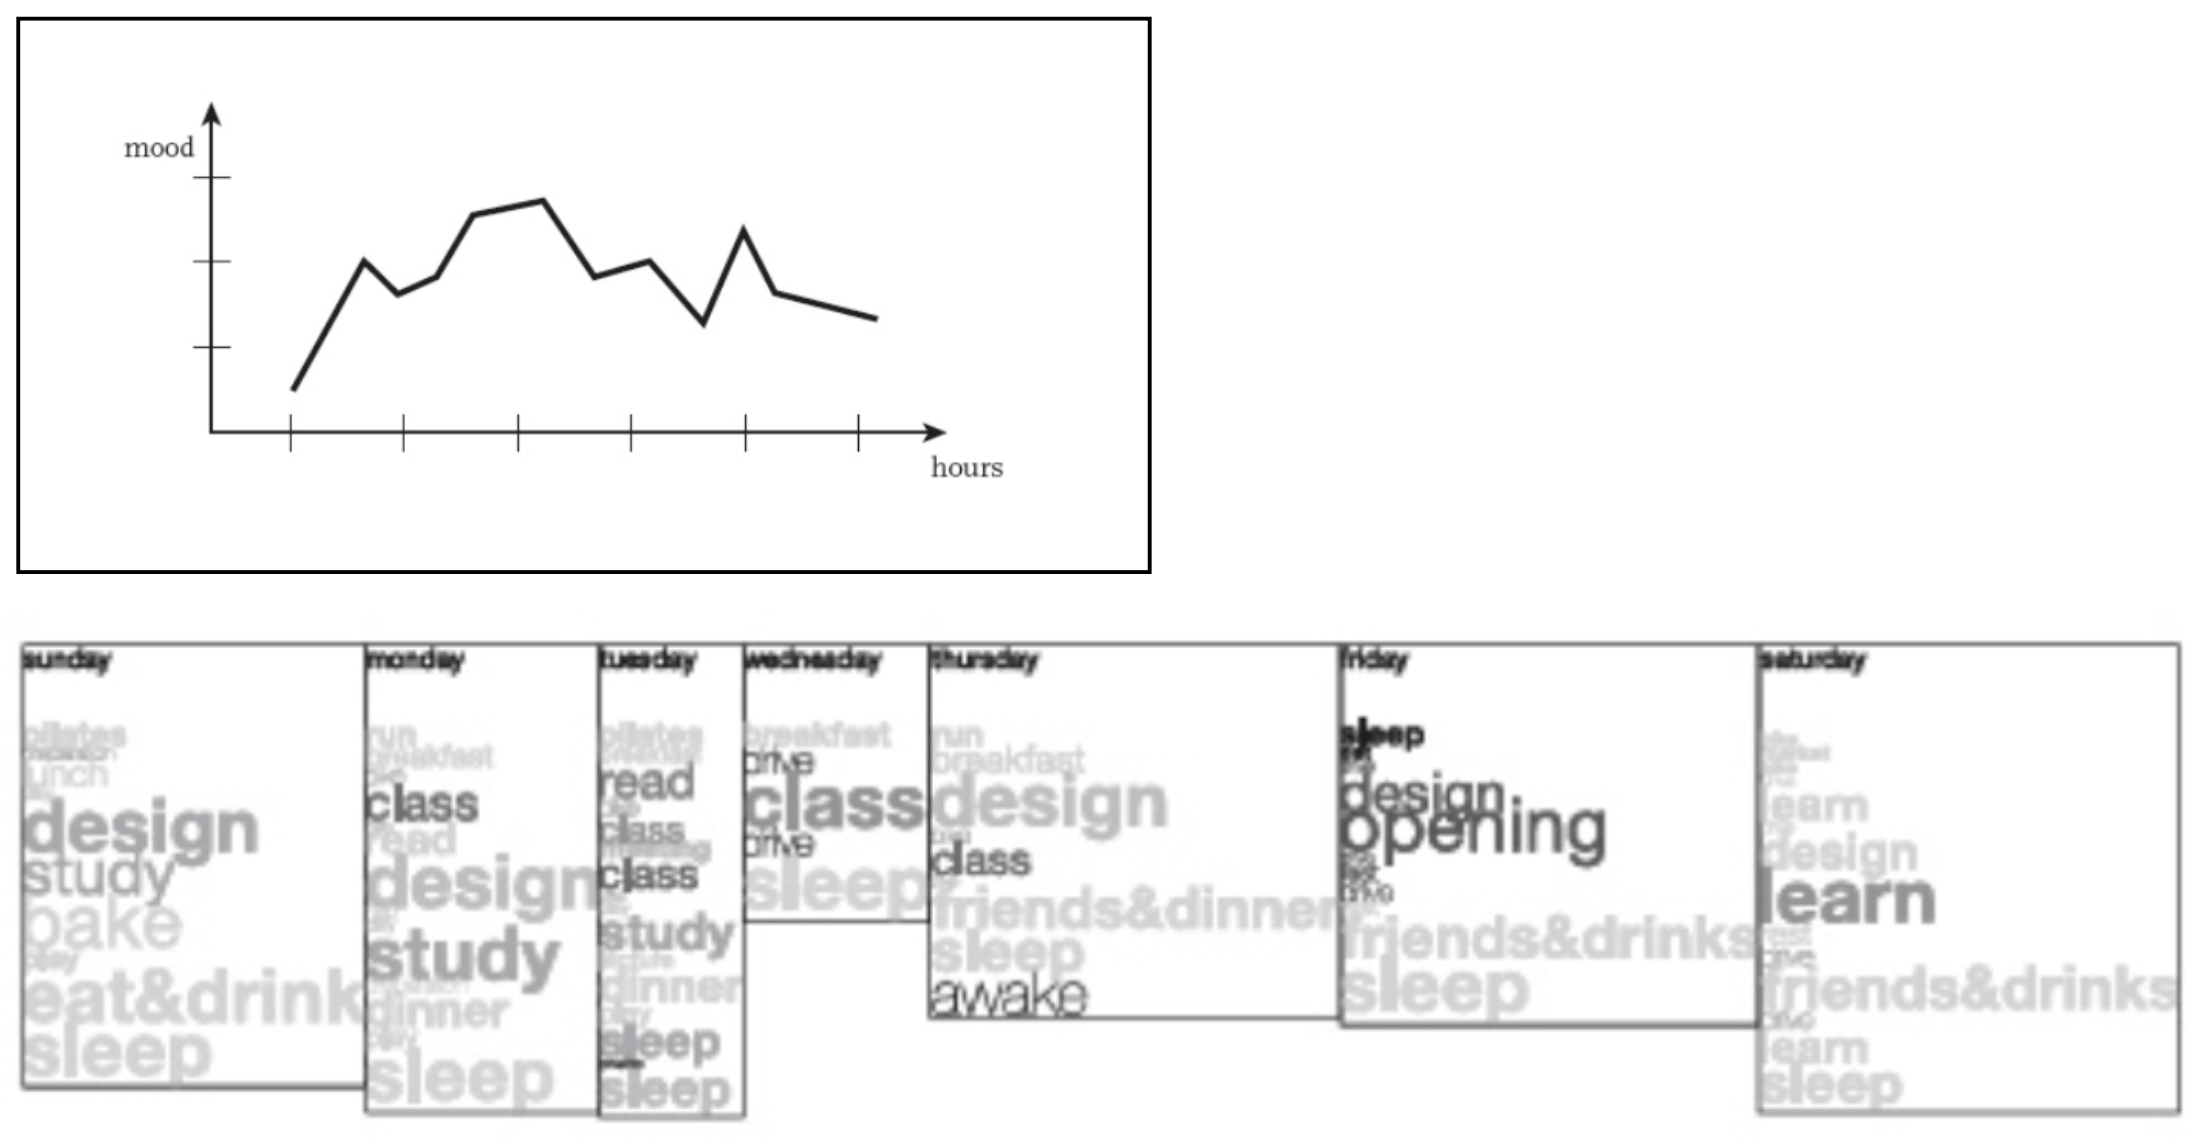
Her technique is to compare a ‘traditional’ graphic representation with one designed according to her principles of interpretative co-dependency. In the examples above (figures 5 and 6 in her text, both credited to Xárene Eskandar), the first uses standard regular metrics to display a ‘record of positive and negative feelings in the course of an afternoon’. In the second, on the other hand, ‘subjective information shapes the metric’: the dimensions of each day-box is determined by the sum of activities within it, themselves given weight, size and tone according to the significance of each for the person whose week is represented.
Of course, one might say that the ‘distortion’, or rather the interpretive projection, of ‘capta’ according to a recognition of the human role in understanding (observer-phenomena co-dependence) is what art has always done. And one possible endpoint of Drucker’s argument might be a kind of practice-research, say where a humanistic-astronomer does a naff painting of the cosmos. But I like the thought that we can stay with graphs or maps or trees to assert a claim on domains of knowledge traditionally associated with the empirical sciences, to extend those domains and to critique the way they have been delimited.
I would love to reproduce a series of four graphs (figures 10-13 in Drucker’s article) which show gradations in the intensity of anxiety experienced over time (the theme of anxiety being close to my heart and to many other parts of my body), except I don’t understand the latter two graphs, which intriguingly purport to ‘create a metric that is the effect of perception, rather than an a priori given’. But the idea of time (and in other examples provided, space) understood and represented as the effect of experience, rather than its container, is very attractive.
This brings me back to my task, which is to create a choreographic score to set for your Task 45: that is (according to the definition you provide), to create a set of instructions that frame a physical exploration. But, based on the thoughts from Drucker, above, I want to think of the score not (or not simply) as a set of instructions—but as a set of effects. I want to think of the score as a chart already formatted by the experience of the moving body, which it expresses as a condition of its very existence. Maybe the suggestive scores, like this one, that you gave in the task as illustrations of possible approaches can be thought of in this way.
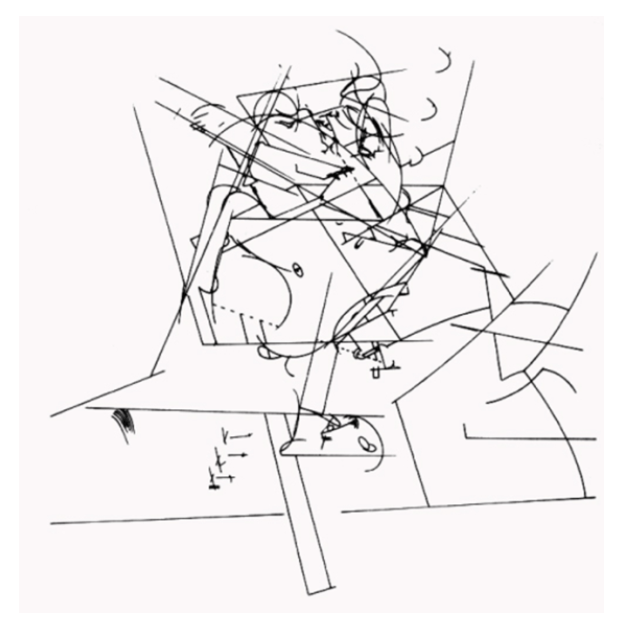
But the score that I am choosing can certainly be thought of in terms of how it expresses the experience of the moving body as the very condition of its being. Here it is, the map-drawing by my friend Erin Pickles of the walk we took through Viby for Task 12 when Erin came to visit last November. (She gives a commentary on the map in Response 12.)

A Walk Through Viby by Erin Pickles
In Erin’s map, items are selected and granted space and representation according to our joint perception and attention. The map takes form—its very units of measure are defined—according to our shared experience and the psychogeographical activity of our friendship on that cold November Friday morning.
I want to think of Erin’s map as one possible response to Drucker’s call for the graphical expression of phenomena according to principles of observer co-dependence and foregrounded interpretation. The map will be the score for your Task 45, as set out here.
P.S.
Graphs, Maps, Trees: Abstract models for a Literary History is the title of a book of three essays by the above-mentioned Franco Moretti (Verso, 2005) that has been very influential on my own work. But I have always felt uncomfortable with it because of a certain… overweening?… tone in Moretti's setting out of his project. Drucker doesn’t mention him by name in her article, but parts of it are a critique of work set out in Moretti’s essay ‘Style, Inc. Reflections on Seven thousand Titles (British novels, 1740-1850)’, originally published in 2009.
